Data Confidence Is Holding Back South Africa’s Business Growth

Data confidence — not budget — is emerging as the real constraint on growth.
One of the clearest findings from Insight 2026, a Digitlab survey of over 350 businesses, is this:
20% of South African organisations operate without a formal data strategy.
For growing businesses — particularly those in the R5–20M range with expanding teams — this isn’t a technical gap. It directly affects growth. It shows up in slower decisions, budget friction, inconsistent reporting, and leadership hesitation when it’s time to scale.While this research focuses on South Africa, the pattern mirrors what we see across growth-stage businesses globally: tools are widely available, but confidence in the data behind them is uneven.
At the same time:
-
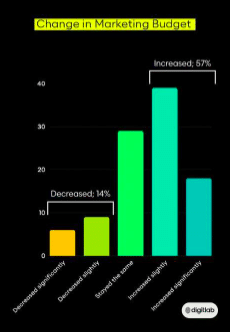
57% of organisations increased marketing budgets in the past year
-
14% reduced spend
-
Nearly half still rely primarily on instinct or experience when making digital decisions
More money is flowing into marketing (see graph). But without structured data, increased spend does not automatically translate into confident growth.
The constraint is no longer access to technology. It is trust in the numbers.
Why Growing Businesses Delay Data Strategy
Most mid-sized businesses don’t deliberately avoid a data strategy. They postpone it.
Growth absorbs attention. Sales targets dominate meetings. Marketing runs campaigns. Finance tracks revenue. Systems get added as needed.
But without structure, data ends up scattered across:
A CRM that is not fully integrated with sales
Marketing platforms reporting in isolation
Spreadsheets stitched together before monthly reviews
Dashboards are a few people fully trust
Data exists — but it doesn’t consistently guide decisions.
That’s the gap.
How This Impacts Marketing Performance and Budget Conversations
In businesses with a formal data strategy, marketing discussions sound different.
- Spend is tied to pipeline or revenue outcomes
- Budget shifts happen based on performance data
- Leadership debates strategy, not numbers
In businesses without that structure, conversations often stall.
Reporting focuses on leads, while finance focuses on revenue. Sales and marketing operate in separate systems. Budget reviews rely on exported spreadsheets rather than shared dashboards.
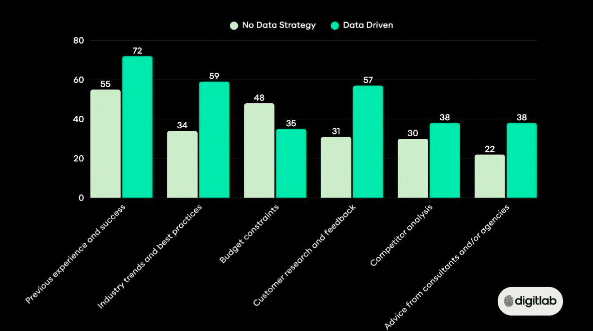
The survey reflects this difference clearly. Data-driven organisations are significantly more likely to rely on customer research (57% vs 31%), industry best practices (59% vs 34%), and competitor analysis (38% vs 30%). Organisations without a data strategy lean more heavily on previous experience (55%) and operate under tighter budget constraints (48% vs 35%).
These are not just different inputs. They produce different levels of confidence.
At the executive level, that confidence determines whether marketing is defended or cut.
The Size Divide: Where the Risk Is Highest
There is an assumption that bigger organisations are automatically more mature. The data shows it’s more nuanced.
From Insight 2026:
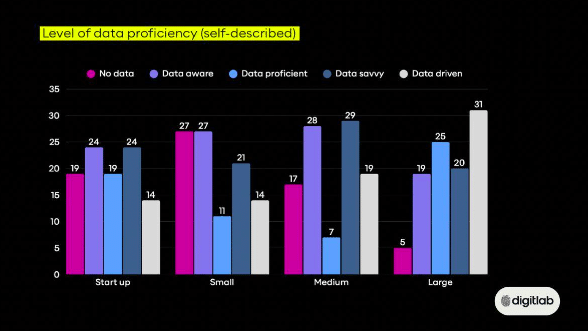
- 67% of start-ups describe themselves as data-proficient or higher
- 55% of medium-sized organisations are data-proficient
- 31% of large enterprises describe themselves as fully data-driven
- 27% of small businesses report having no data strategy at all
- Start-ups often build integrated systems from day one. Large enterprises invest heavily but struggle with complexity.
The real pressure point is the growing mid-market business — scaling teams, adding tools, but not yet formalising integration.
In emerging and developed markets alike, this stage of growth is where competitive advantage is either built through system design or diluted through fragmentation.
This is where data maturity can be either an advantage or a bottleneck.
What Data Maturity Looks Like in a 50–150 Person Business
It is not sophisticated AI dashboards or enterprise analytics suites.
It looks like:
- CRM is connected properly to sales reporting
- Marketing automation tied to revenue and pipeline
- Agreed definitions of leads, opportunities, and conversion rates
- Automated reporting replacing manual reconciliation
- This is where maturity becomes measurable.
- The survey shows a pattern: organisations that are increasing their marketing budgets are expanding automation and deepening CRM integration. Those reducing budgets narrow tool breadth and operate with less integration depth.
Growth aligns with integration. Contraction exposes fragmentation.
MarTech Adoption by Budget Movement
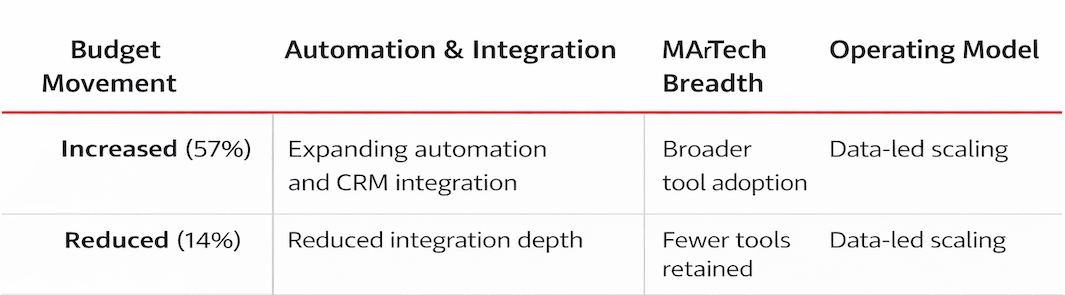
For a growing business, the message is simple: integration strengthens resilience.
AI Adoption Is Rising — But Foundations Matter More
AI has entered most marketing teams. It has not yet reshaped most operating models.
From Insight 2026:- Around half of organisations report using AI assistants or generative tools
- Only 13% describe AI as integral to core operations
Experimentation is common. Integration is limited.
Using AI to generate content is not the same as embedding it into forecasting, automation, and decision-making.
If CRM data is inconsistent and reporting is fragmented, AI simply accelerates the noise.
For mid-sized businesses, the risk is not missing out on AI tools. It is layering AI onto systems that are not yet connected.
Access to AI is no longer an advantage. Integrated AI is.
Confidence Is the Real Competitive Edge
Most growing businesses now have access to the same technology stack: CRM, marketing automation, AI tools, and analytics platforms.
What separates leaders is not access. It is confidence.
- Confidence to invest.
- Confidence to defend the budget.
- Confidence to scale marketing without losing visibility.
That confidence comes from structured data.
As automation deepens and competition tightens, the gap between integrated and fragmented businesses will widen.
In a globally connected economy — where competitors can enter markets digitally with fully integrated systems from day one — fragmented data is not just a local weakness. It is a structural disadvantage.
In 2026, leadership will not be defined by who adopts the most tools.
It will be defined by who can see clearly enough to act — a divide reflected directly in the data confidence levels shown in the accompanying graph.
Source: Insight 2026, a Digitlab survey
Agency to watch
Best in Breed since 1998. Lounge Lizard is a Digital Agency that Specializes in Brand Strategy, Website Design, Web Development, Mobile APP Development, Online Marketing, Social Media, Ecommerce, and SEOdigital experiences that move brands and businesses from now to next.
Featured agencies
135194 Views
115719 Views
109445 Views
91944 Views

88473 Views

83237 Views
74869 Views

61631 Views